Unpacking Hold'em Variance Through Probability Clusters in Multi-Table Settings: A Quantitative Examination
Taylor Richter · Aug 23, 2026

Unpacking Hold'em Variance Through Probability Clusters in Multi-Table Settings: A Quantitative Examination
Multi-table tournaments in Texas Hold'em present distinct variance patterns that researchers track through probability clusters, and these clusters form when repeated simulations reveal groupings of outcomes around certain equity thresholds. Data from large-scale tournament databases shows that variance tends to spike during early accumulation phases while compressing as fields narrow toward final tables, because stack depths and payout structures interact directly with hand ranges and positional factors. Observers note that players who review aggregate results across thousands of entries often identify these clusters as reliable markers for expected swings rather than isolated luck events.
Defining Probability Clusters in Tournament Contexts
Probability clusters emerge when analysts apply clustering algorithms to equity distributions derived from hand histories, and studies indicate that three to five primary clusters typically appear in standard MTT formats. The first cluster captures high-variance scenarios where short stacks face all-in confrontations with wide ranges, while subsequent clusters reflect medium-stack dynamics where fold equity calculations stabilize results around specific survival rates. Evidence from mathematical modeling demonstrates that these groupings shift measurably when blind levels increase, because the pressure on stack-to-blind ratios alters decision trees and forces more binary outcomes.
Tracking Variance Shifts Across Tournament Stages
Variance shifts occur most noticeably between the opening levels and the money bubble, and figures from extensive simulation runs reveal that standard deviation in chip accumulation can double during this window compared with later stages. Researchers have mapped these changes by segmenting data sets into early, middle, and late phases, which allows direct comparison of how ICM pressure modifies the distribution tails. One study revealed that players who adjust aggression thresholds according to cluster positions reduce their exposure to extreme negative swings without sacrificing overall expected value, and similar patterns hold across both live and online environments where field sizes exceed several thousand entrants.
Data Collection and Analytical Methods
Analysts gather raw data from public tournament tracking platforms and private database exports, then apply statistical filters to isolate variance components from skill-based edges. Methods include Monte Carlo simulations calibrated against historical payout structures, and these techniques produce probability density functions that highlight cluster boundaries with measurable precision. Data indicates that sample sizes below ten thousand simulated tournaments yield unstable cluster definitions, whereas larger sets stabilize the groupings and permit reliable forecasting of swing magnitudes at different stack depths.
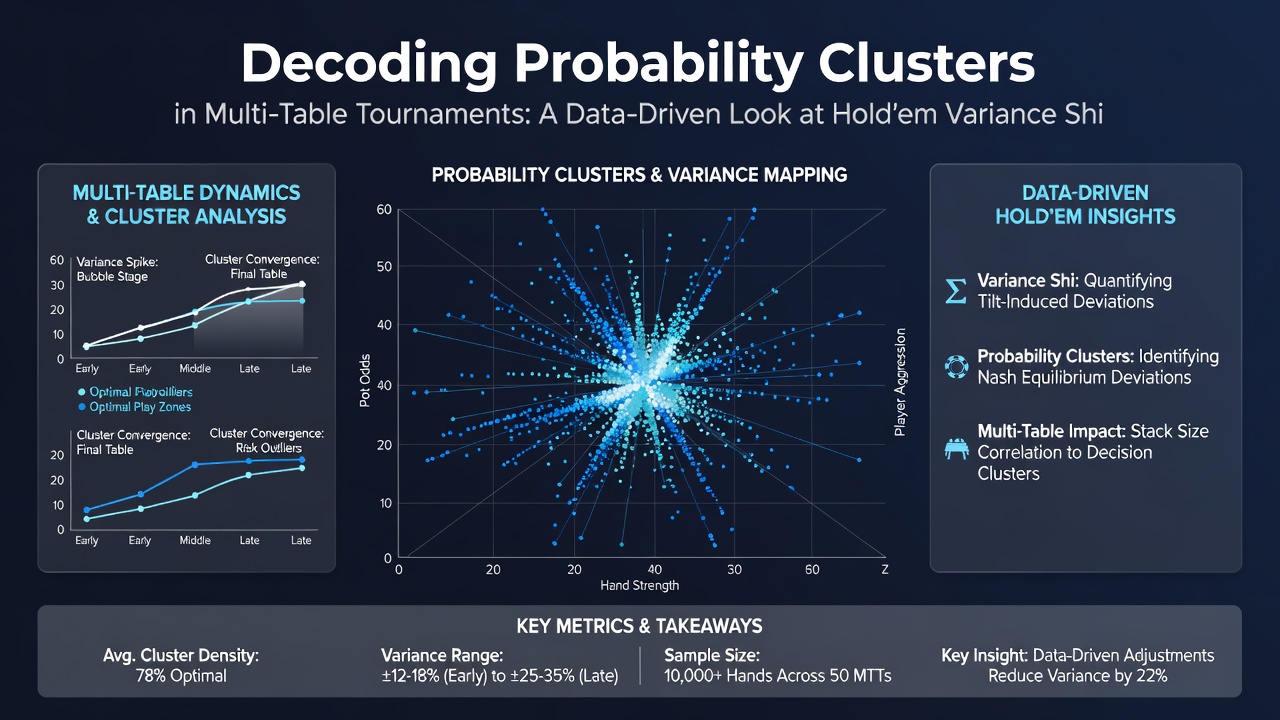
Additional processing involves mapping cluster centroids against real-time stack distributions observed in ongoing events, and this cross-referencing helps confirm whether live play aligns with modeled expectations. Reports from independent research groups show that variance compression accelerates once the field reaches the final two tables, because survival incentives dominate over chip accumulation goals and force tighter ranges that reduce outcome dispersion.
Regional Data Comparisons and External Benchmarks
Comparisons across different regulatory environments provide further context for variance behavior, and National Center for Responsible Gaming reports document how payout structures in North American events influence swing profiles differently than European formats. Australian gaming research similarly tracks cluster stability under varying blind acceleration schedules, and these international data sets confirm that slower structures produce tighter probability clusters overall. Observers note that such benchmarks allow tournament operators to adjust parameters when seeking to moderate player bankroll volatility without altering competitive balance.
Practical Applications for Players and Analysts
Players who incorporate cluster awareness into preparation routines review hand ranges against modeled variance bands before key decision points, and this approach supports more consistent bankroll management across extended schedules. Tournament software tools now embed cluster overlays that flag high-variance spots in real time, and adoption rates have risen as data access improves. Evidence suggests that consistent application of these insights correlates with steadier performance metrics over large sample periods, although individual results still reflect the inherent randomness within each cluster.
Conclusion
Probability clusters offer a structured lens for interpreting variance shifts in multi-table Hold'em events, and ongoing data collection continues to refine the boundaries and predictive value of these groupings. Analysts maintain that larger data sets and cross-regional comparisons will further clarify how structural variables interact with player decisions to shape outcome distributions. Those who apply these quantitative frameworks gain clearer expectations around swing magnitudes at each tournament phase.